Read the Home and Analytics screens: what every number means
What the Home tiles count, what needs you now, and what the Analytics tabs show — funnel, acquisition, conversations, sales and costs.
Home answers "what needs me today": what the agent handled, who needed a person, new and qualified leads, revenue won and spend, over a range you pick. Analytics goes deeper in five tabs — Funnel, Acquisition, Conversation, Sales and Costs — with a choice of first touch, last touch or linear attribution.
Home
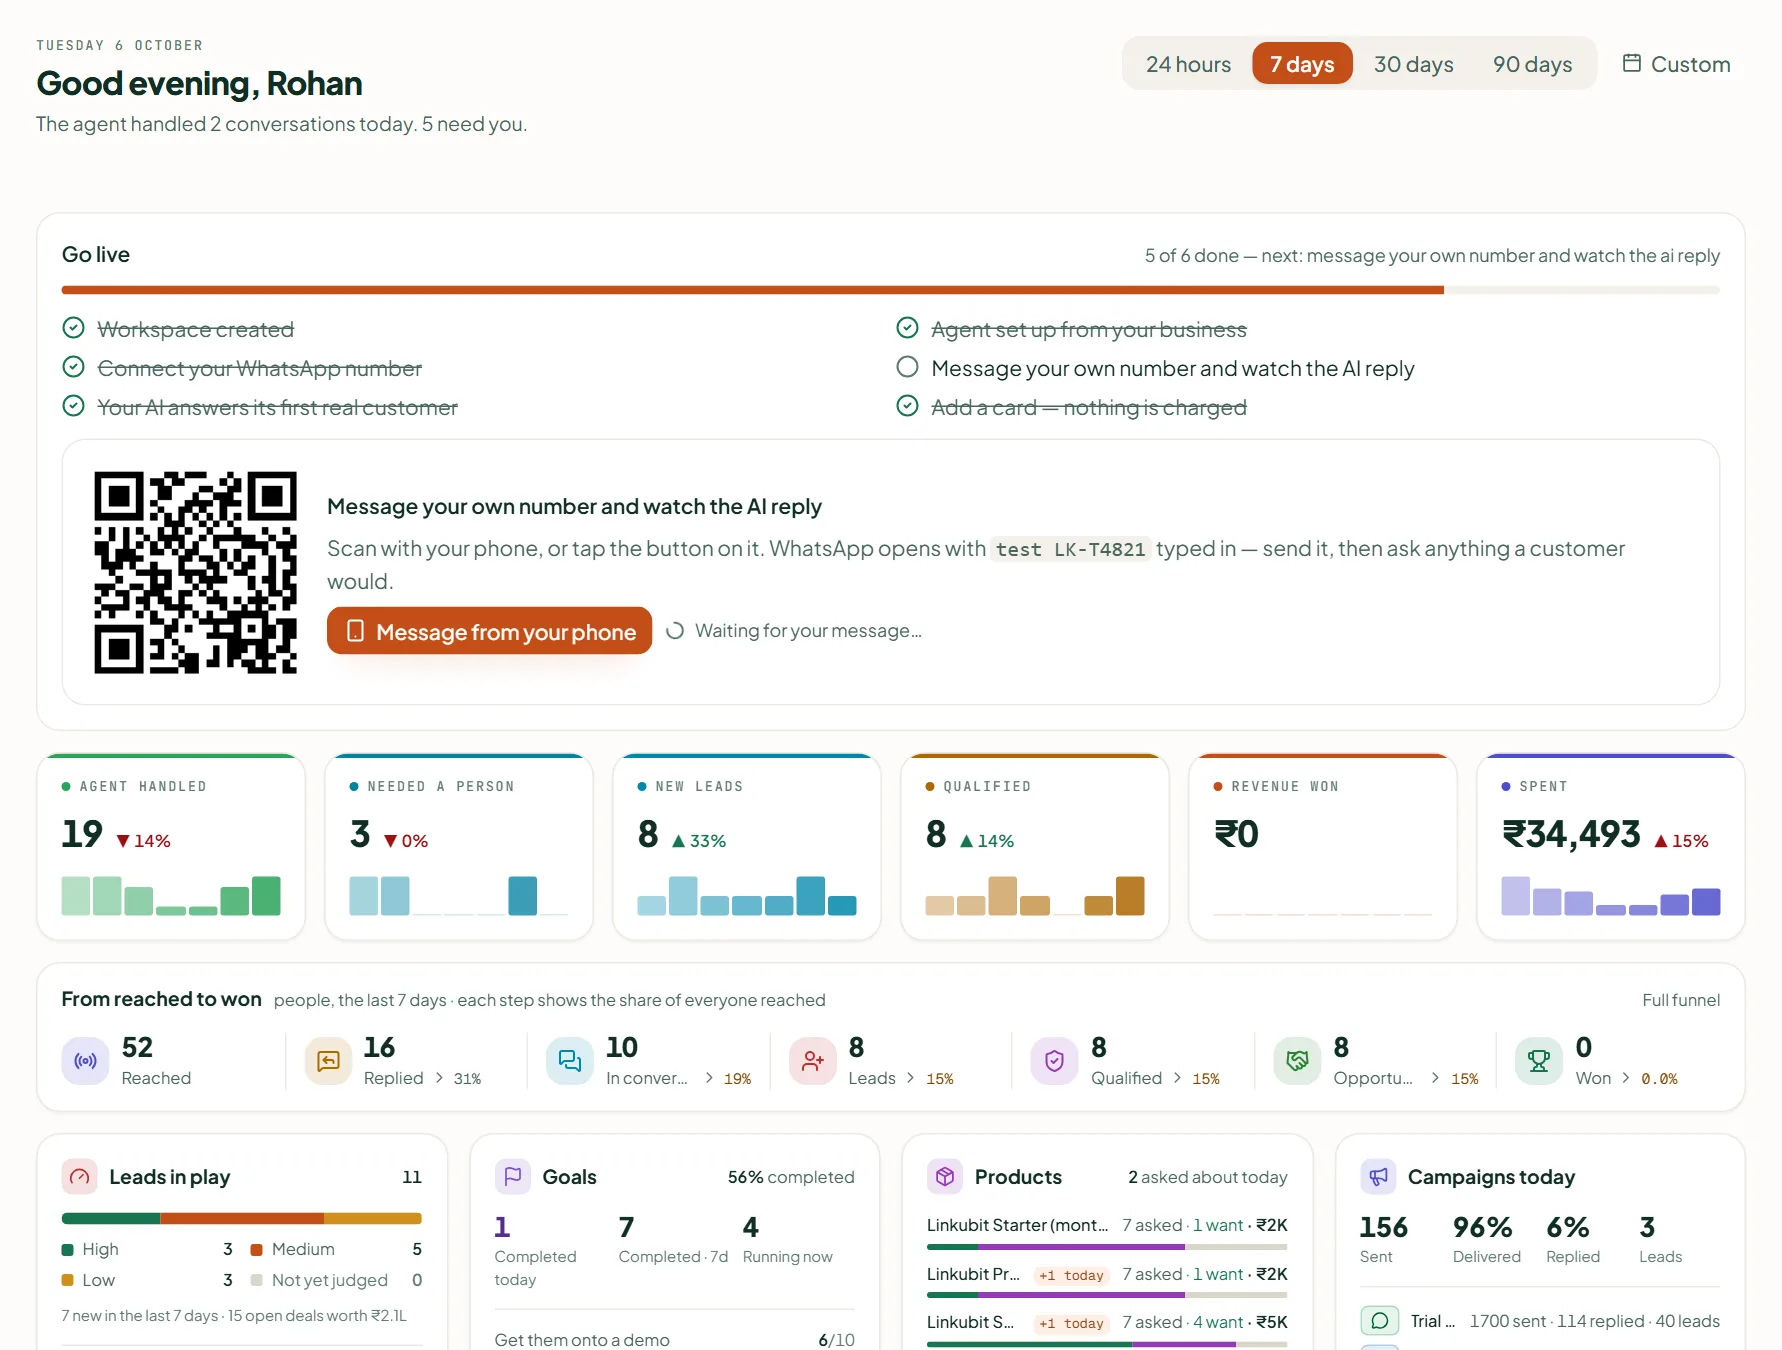
Pick a range — 24 hours, 7, 30 or 90 days, or your own dates. The tiles, each with the change against the period before, are Agent handled, Needed a person, New leads, Qualified, Revenue won and Spent. Below them:
- Needs you now — people waiting on a reply, approvals, and overdue tasks, at most six; "Nothing waiting. The agent has it." when there are none.
- From reached to won — the funnel.
- Stage flow — open opportunities by stage.
- What worked — the campaigns and ads that produced results.
Analytics
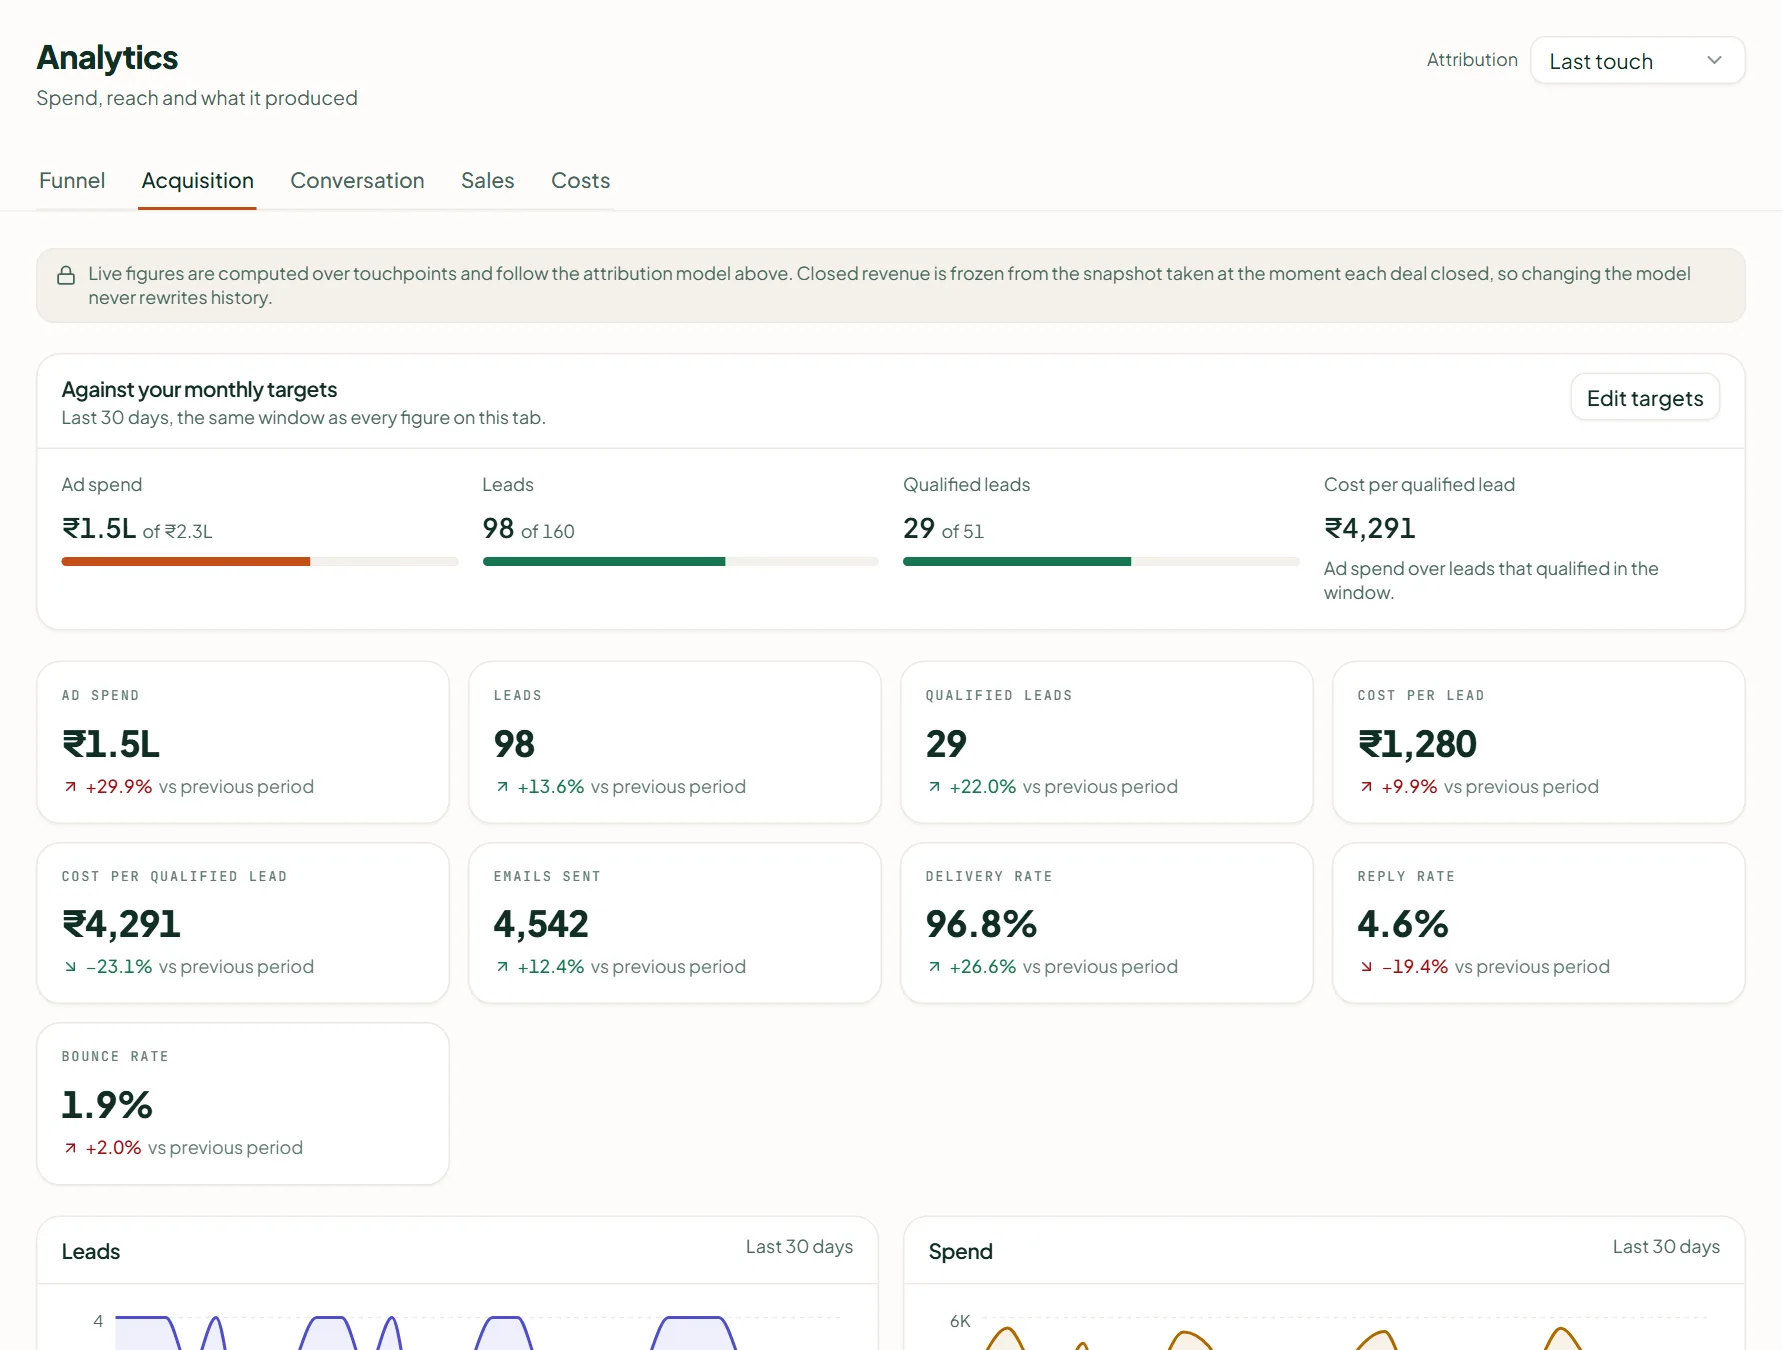
| Tab | What it shows |
|---|---|
| Funnel | From everyone reached to every deal won — people, not rows |
| Acquisition | Spend, reach and what it produced: cost per lead and per qualified lead, leads by source, deliverability (bounce and complaint rates) |
| Conversation | Who handled what, by channel, and where a person stepped in |
| Sales | Qualification, pipeline, win rate and revenue |
| Costs | Ad spend, Meta's messaging fee and credits — every line, by day |
Attribution — First touch, Last touch (the default) or Linear — changes how live figures credit a channel; revenue from a closed deal is fixed at the moment it closed. Currencies are never converted: a figure in another currency sits beside the total, not inside it.
Related
Stuck? Write to help@linkubit.com with the screen you are on and what it says. Not using Linkubit yet? Start free — fourteen days of Pro, no card.